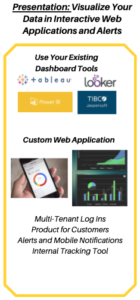
In this series we have discussed some of the myths of business analytics, and important components to a successful solution including data lakes and intelligence on your data. Finally, it is time to put the presentation in place. This is where dashboard tools can really shine.
Before embarking on dashboard development it’s important to review your questions and start to sketch out how you want to answer them. Dashboards are only one kind of presentation method, and like the others they have strengths and weaknesses. Dashboards are great for a team to see their numbers, to regularly review business processes and make sure your KPIs are on track or to dig in and troubleshoot problems with your numbers. Dashboards are well suited for recurring updates that are part of a business process such as preparation for a monthly management update.
However, some analytics needs are based more on unexpected questions of curiosity rather than as numbers required to meet recurring processes, such as a quarterly management report. In some cases, curiosity driven work may lead to questions like the total number of customers in a geographic region or the top ten transactions by revenue. Because the data lake makes raw information available, there is no need to design dashboards for every conceivable question. Dashboards require an upfront investment, so anticipating every conceivable question can be prohibitively expensive. Invest judiciously for the questions that carry a known strategic value. Leave unforeseen questions to the ad hoc analysis that can be supported by your Data Lake. That is how you use each part of the solution to its strengths.
Dashboard Tools Abound
Most dashboard tools will have plenty of features so the tool you select is less important than they would have you believe. Almost all will have a few key capabilities you should familiarize yourself with to get the most out of an analytics dashboard. An important capability to consider when investing in your solution is alerting. When new information arises and a stakeholder needs to act on it in a timely manner, an alert is a necessary modality. Additionally, it’s important to start with the questions you are asking to consider whether you need ad-hoc or pixel-perfect reporting. These terms of art mean a great deal in the business intelligence industry. Ad-hoc usually refers to visuals, reports and dashboards that can quickly be put together with a tool that focuses on making content creation simple. Pixel-perfect on the other hand refers to content that must be more systematically developed to meet specific palette and brand criteria. Want to see a trend of sales? An ad-hoc report should serve you well. Want to send an invoice with a specific format, colors and properly fitted logo? Pixel-perfect reporting is more likely what you need. As you can imagine, pixel-perfect reporting is the less common use-case for internally facing business analytics. Understanding the difference between the two is however an important step in selecting your tooling.
Dashboard Tools Aren’t Complete Solutions
While dashboard tools offer a variety of features for presenting data, they are only one part of a complete analytics solution rather than a complete solution on its own. Without an established data lake to store your structured and unstructured data and the intelligence level where you can blend that data, a dashboard tool becomes another investment that doesn’t give you the answers you were looking for. Blacklight Solutions provides clients with a complete solution and can even connect to the dashboard tool you’re already using to provide intelligence-driven, quality presentations.
Presentation is critical, but the specific dashboarding tool is not. It is important to understand the value of these tools against the business problems you are hoping to address. Blacklight Solutions provides the complete business analytics solutions that adjust to fit your exact needs and budget. Our experts provide guidance at every level of your analytics solution to ensure you receive a return on your investment. The final part of our five-part series on The Myths of Business Analytics will show you the benefits of choosing a complete solution.
Click here if you’d like to talk to one of our experts on how to get started!


